Current Housing Fear Index (HFI)

Chris Waltzek

August 16, 2012

Although there are many useful factors for deriving home prices, such as regional market conditions, pool of available buyers, access to easy loans (FHA), low interest rates, unemployment level, and new home construction, analysts opinions (qualitative analysis) vary widely with regard to home price values. Quantitative analysis takes over where qualitative analysis ends. The Current Housing Fear Index (HFI)* essentially uses statistics to cut through the noise and rhetoric in order to quantify the true median home price value given the shadow inventory of homes (Figure 1.1.) and government largess, e.g.., QE and Fed stimulus represented by the M3 (Figure 1.2.):
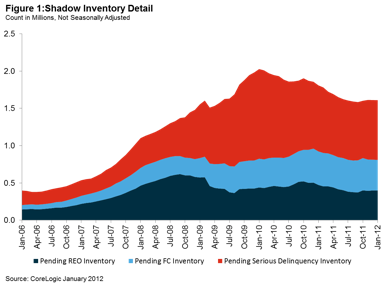
Figure 1.1. US Shadow Inventory 2006-2012

Figure 1.1. Courtesy of USAToday.com


Figure 1.2. M3 Money Supply

Figure 1.2. Courtesy of shadowstats.com)


In order to determine a fair value for the US median home, first the 2006 HFI is calculated given total existing inventories in equation 1.1.. Next the 2012 median home price is calculated in equation 1.2:

HFI Total Inventories Formula (click links for data sources):

2006 HFI = 124,600,000 + 400,000 * $192,300 / 8,500,000M = 2.83
1.1
2012 HFI = 131M + 1,500,000 * $168,000 / 14,750,000M = 1.51
1.2.
To determine the current value of total homes relative to the 2006 housing market peak valuation, the 2006 2.83% figure is substituted into the 2012 computation as seen in equation 1.3:
2012 HFI = 131M + 1,500,000 * $Price / 14,750B = 2.83
2012 HFI = 131M + 1,500,000 * $Price = 2.83% * 14,750B
2012 HFI = 132.5M * $Price = 41742500000000
2012 HFI = $Price = $315,038
1.3

Therefore, given the total inventories and shadow stockpile, housing is a bargain. However this number is distorted due to the fact that only a fraction of the total inventories are for sale. The next set of equations adjusts for this factor. The 2006 HFI is computed given total homes for sale in equation 1.4.. Next the 2012 HFI is calculated in equation 1.5:

HFI Total For Sale Formula (click links for data sources):

2006 HFI = For Sale + Shadow*Median $ / 2006 M3 =
2006 HFI = 1.8M + 400,000 * $192,300 / 8,500,000M = 5%
1.4
2012 HFI = For Sale + Shadow * Median $ / 2012 M3 =
2012 HFI = 2.5M + 1,500,000 * $168,000 / 14,750,000M = 4.6%
1.5.
In order to determine the current value of homes for sale relative to the 2006 housing market peak valuation, the 2006 5% figure is substituted into the 2012 computation as seen in equation 1.6:


2012 HFI = For Sale + Shadow * Median $ / 2012 M3 =
2012 HFI = 2.5M + 1,500,000 * $? / 14,750,000,000,000 = 5%
2012 HFI = 2.5M + 1,500,000 * $? = 5% * 14,750,000,000,000
2012 HFI = 2.5M + 1,500,000 * $? = 737500090000
2012 HFI = 2.5M + 1,500,000 * $? = 737,500,090,000 / 4,000,000
2012 HFI = $? = 737,500,090,000 / 4,000,000 =
2012 HFI = $ = $184,375
1.6.

Thus, according to the HFI figure, in 2012, $184,375 is the fair value of the typical US house for sale. Since the 2012 HFI figure $184,375 is 10% above the current median house price $168,000, buying a home is deemed prudent. Put simply, after 6 years of brutal selling, despite the large shadow inventory, buying a home may be a wise decision.

Please click this link for the Gold and Silver Fear Indexes: click here. If you'd like acces to my weekly stock picks including gold stocks, high frequency trading robots and much more, please sign up below:

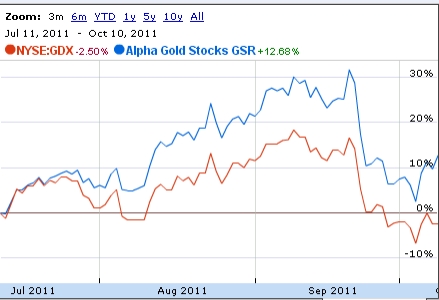
Alpha Gold Stocks

Beats the XAU/GDX 44%

Click Below:

*Special thanks to James Turk and goldmoney.com for the use of the Gold Fear Index calculation.


PLEASE READ CAREFULLY - Disclaimer: Information provided must not be construed as a recommendation to buy or sell any security or financial instrument, or to participate in any particular trading or investment strategy. The author / editor of this web site has not been paid by any company or service to promote the stock picks. All stocks are chosen entirely due to technical / fundamental characteristics. Any action taken as a result of information, analysis, or advertisement is ultimately your responsibility. The host and author is not a paid adviser. Investing in high alpha stocks involves substantial risk. Past performance is no guarantee of future returns. Consult your investment adviser before making any investment decisions. Investors are advised to apply only a fraction of their total portfolio, less than 2% to the total of all picks. Only RISK CAPITAL should be used due to the high volatility associated with such investments. None of the stock information, data and company information presented herein constitutes a recommendation or a solicitation of any offer to buy or sell any securities. Information presented is general information that does not take into account your individual circumstances, financial situation, or needs, nor does it present a personalized recommendation to you. Individual stocks presented may not be ideal to your investing objectives. Although information has been obtained from and is based upon sources believed to be reliable, we do not guarantee its accuracy and the information may be incomplete or condensed. All opinions and estimates constitute judgments contingent upon the date of the report and are subject to change without notice. This report is for informational purposes only and is not intended as an offer or solicitation for the purchase or sale of a investment security. Past performance is no indication of future results.


©Gold Seek LLC & ©Chris Waltzek 2010-2011. All Rights Reserved.