©Gold
& Silver Fear Indexes
Current
Gold Fear Index (GFI)
August
16, 2012
Chris
G. Waltzek
A
discussion
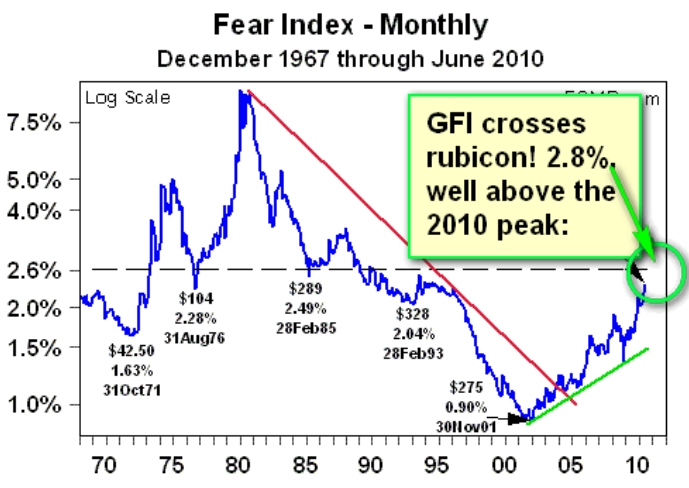
with James Turk this week renewed my interest in
his Fear Index. So I decided to calculate the current
figure. Given the 2.8% GFI figure listed in the equation
above, clearly the gold market mania phase is only beginning,
when compared to the 1980's peak:
 (Courtesy
of GoldMoney.com) (Courtesy
of GoldMoney.com)
GFI
Formula (click
links for data sources):
GFI
= 261,500,000 * $1,600 / 14,750,000,000,000 = 2.8%
Next
we use the formula to extrapolate a gold price forecast.
The chart shows the Fear Index apogee of roughly 9% in
1980. So we plug in a new gold price of $5,000 which results
in 9% GFI reading.
GFI
= 261,500,000 * $5,000 / 14,750,000,000,000
= 9%
Thus
according to the GFI, the fair value for gold is $5,000.
Keep in mind that the gold price forecast moves higher
as the M3 money supply figure increases. For instance,
if we assume the M3 climbs to the number listed below,
in accordance with expectations, gold could soar above
$5,000, to $7,000:
GFI
= 261,500,000 * $7,000 /
20,000,000,000,000 = 9%
NEW:
Current Silver Fear Index (SFI)
Updated: September
13, 2012
Formula
(click links for data sources):
The
GFI index can be used to determine the fair value of silver,
by simply using the gold/silver ratio. Assuming a GFI figure
of $5,000 and a gold/silver ratio of 50, the expected silver
price is: $5,000 / 50 = $100. However, to derive a more
accurate silver estimation, we apply the GFI formula to
the silver market, resulting with a new indicator: the silver
fear index (SFI). Since the government has sold off the
strategic silver stockpile, all three billion ounces and
the US Mint must purchase silver from the free market, the
silver market balance figures produced by the CPM
Group are used. This figure represents the annual silver
inventories. First we calculate the SFI for the 1980's peak
price of $50 to use as a base for common size measurement:
.54%. Next we calculate the current SFI: .04%.
Clearly the silver price is EXTREMELY undervalued relative
to 1980. But precisely how undervalued is silver, relative
to the 1980's peak?
SFI
= 210,000,000 * $50 / 1,935,100,000,000 = .54%
SFI
= 200,000,000 * $30 / 14,750,000,000,000 = .04%
To
determine how undervalued silver is today relative
to the previous bull market peak price, the .54%
SFI number from the 1980 calculation is substituted
into the 2012 equation:
SFI
= 200,000,000 * $Silver? / 14,750,000,000,000
= .54%
SFI
= 200,000,000 * $Silver? = .54%
*14,750,000,000,000
SFI
= 200,000,000 * $Silver? = 79650000000
SFI
= $Silver? = 79650000000
/ 200,000,000
NEW:
Therefore,
the SFI indicates that silver must climb to nearly
$400 in order to reach it's current fair value.
Anecdotally, this is precisely the silver target
I proposed in Wealth Building Strategies (2010).
Nevertheless, the $400 price is likely overstated
due to the fact that gold has not been included
in the calculations. Next the GFI and SFI indexes
are combined and adjusted by gold relative to silver
(50 = 49/50 = .98) and silver relative to gold (1/50
= .02) resulting with a current silver estimate:
Silver
FV = GFI ($5,000) + SFI
($398) = $5,398 * Silver:Gold (1/50) =
$108
Gold
FV = GFI ($5,000) + SFI
($398) = $5,398 * Gold:Silver(49/50) =
$5290
So
investors should expect silver to climb to $108
and gold to $5,398
per ounce. Although the numbers listed above
are close approximations, for a more accurate calculation
of the gold and silver fair value estimates, the
GFI and SFI formulas must be combined within the
original M3 money supply computation. This article
is dynamic - the formulas will be updated after
this semester is over. Please click this link for
the Housing Fear Index (HFI): click
here.
|
|
PLEASE
READ CAREFULLY - Disclaimer: Information provided must
not be construed as a recommendation to buy or sell any
security or financial instrument, or to participate in any
particular trading or investment strategy. The author /
editor of this web site has not been paid by any company
or service to promote the stock picks. All stocks are chosen
entirely due to technical / fundamental characteristics.
Any action taken as a result of information, analysis, or
advertisement is ultimately your responsibility. The host
and author is not a paid adviser. Investing in high alpha
stocks involves substantial risk. Past performance is no
guarantee of future returns. Consult your investment adviser
before making any investment decisions. Investors are advised
to apply only a fraction of their total portfolio, less
than 2% to the total of all picks. Only RISK CAPITAL should
be used due to the high volatility associated with such
investments. None
of the stock information, data and company information presented
herein constitutes a recommendation or a solicitation of
any offer to buy or sell any securities. Information
presented is general information that does not take into
account your individual circumstances, financial situation,
or needs, nor does it present a personalized recommendation
to you. Individual stocks presented may not be ideal to
your investing objectives. Although information has been
obtained from and is based upon sources believed to be reliable,
we do not guarantee its accuracy and the information may
be incomplete or condensed. All opinions and estimates constitute
judgments contingent upon the date of the report and are
subject to change without notice. This report is for informational
purposes only and is not intended as an offer or solicitation
for the purchase or sale of a investment security. Past
performance is no indication of future results.
|
| |
©Gold
Seek LLC
|
|